Screen exposure before committing capital
Identify flood, climate, access, terrain and environmental constraints around assets and projects.
Geospatial analytics services
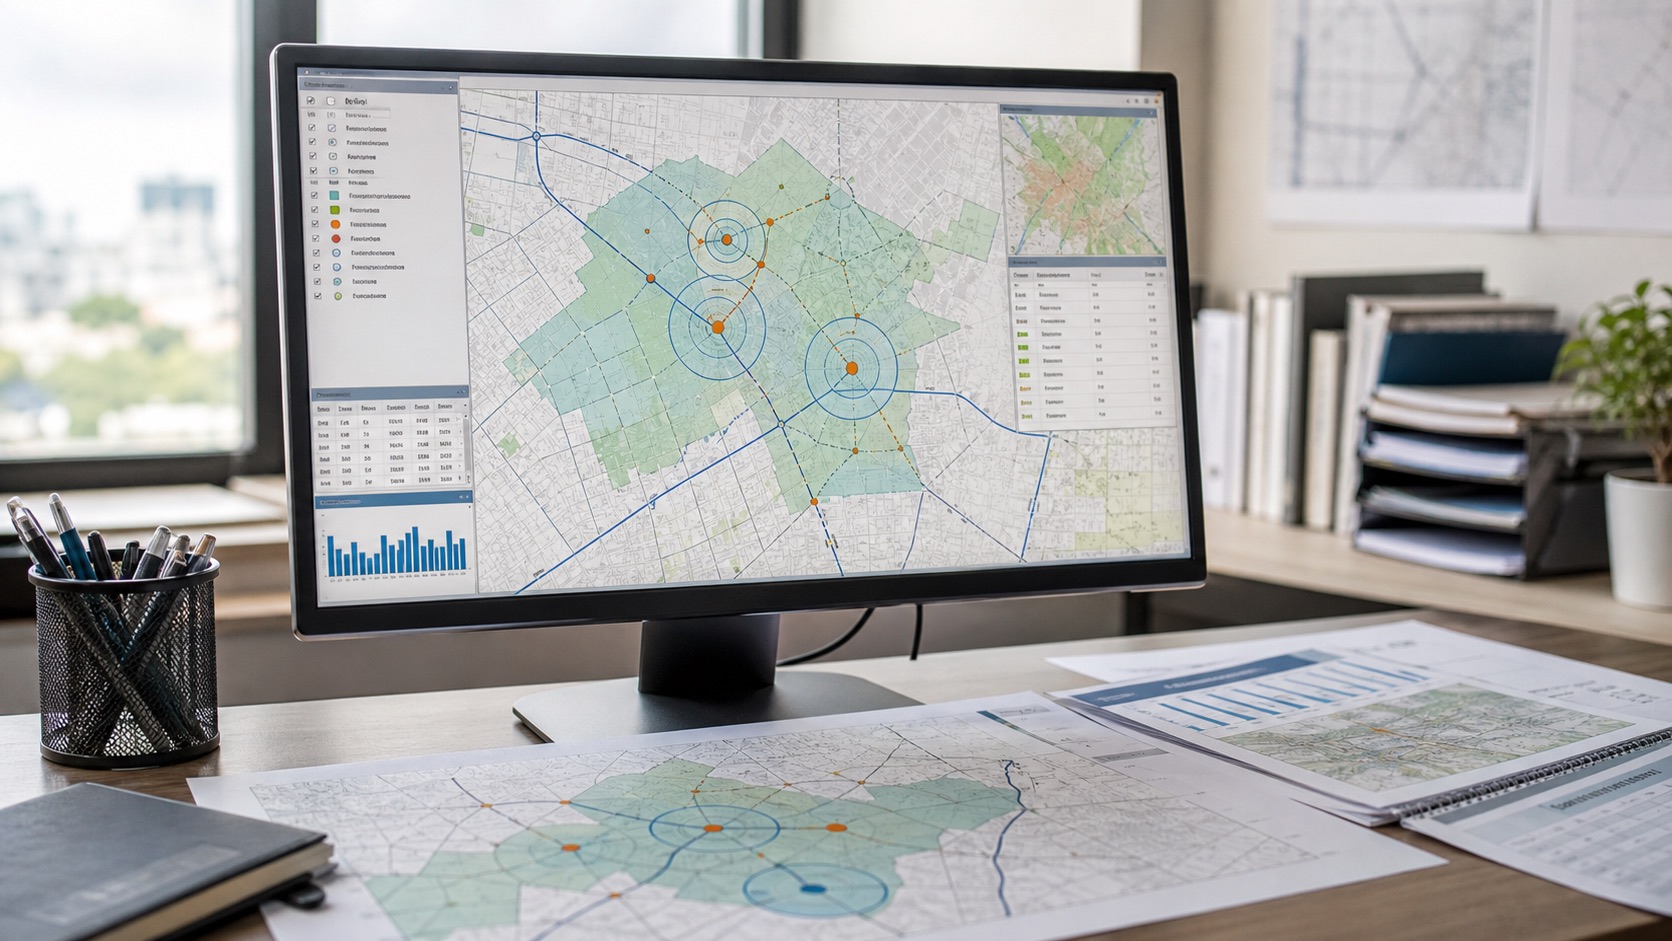
We turn coordinates, boundaries, terrain, rainfall, satellite imagery and local constraints into GIS maps, mobile GIS workflows, web GIS dashboard requirements, asset-level risk reports, flood risk mapping, MCDM site suitability analysis and remote sensing outputs.
What we prepare
Most projects start with a site list, boundary, catchment, corridor or asset portfolio. We clean the location data, select the right spatial layers, run the analysis and document the assumptions.
Asset-level climate risk, hazards, access, market context, environmental exposure and source coverage around each location.
Explore risk analytics → 02Hydrological modelling, hydraulic modelling, floodplain mapping, drainage analysis, inundation maps and exposed assets.
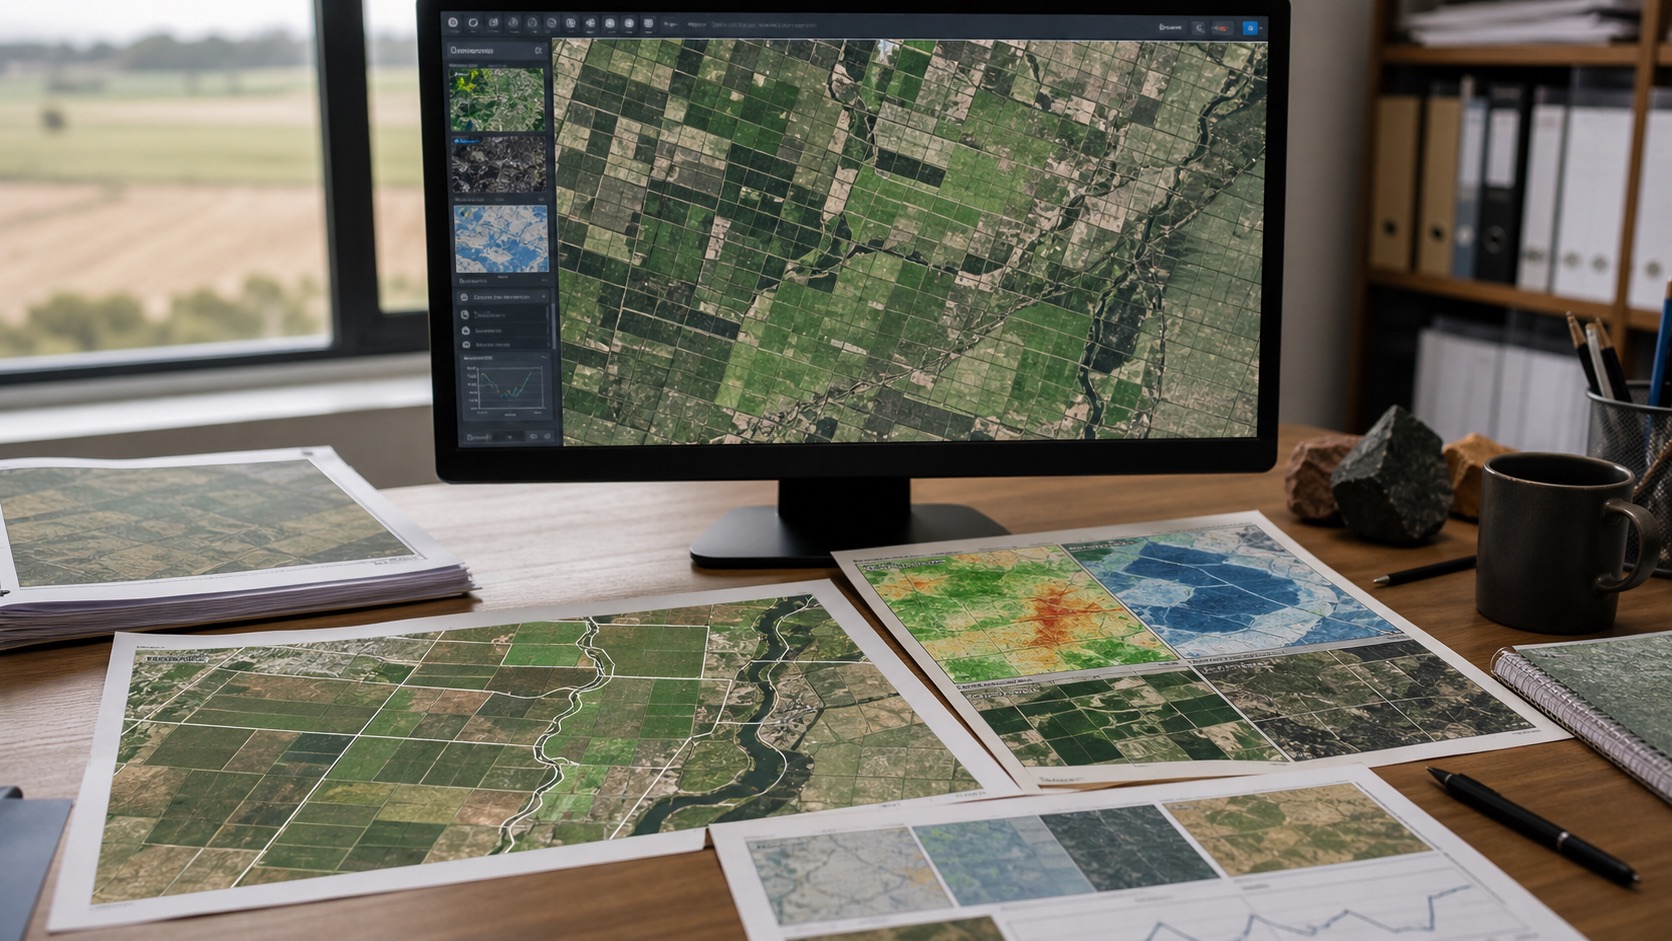
Explore flood modelling services → 03NDVI, vegetation health, crop condition, land cover, water, heat, change and farming indicators from satellite imagery workflows.
Explore remote sensing agriculture services → 04Flood, heat, drought, water stress, storm, wildfire and environmental sensitivity screening for assets or portfolios.
Explore climate analytics → 05Rank sites, service areas and routes using demand, access, competition, cost, constraints and risk.
Explore location strategy → 06Screen solar plant sites using irradiance, slope, land cover, flood risk, access, grid proximity and environmental constraints.
Explore solar site selection →Sample deliverables
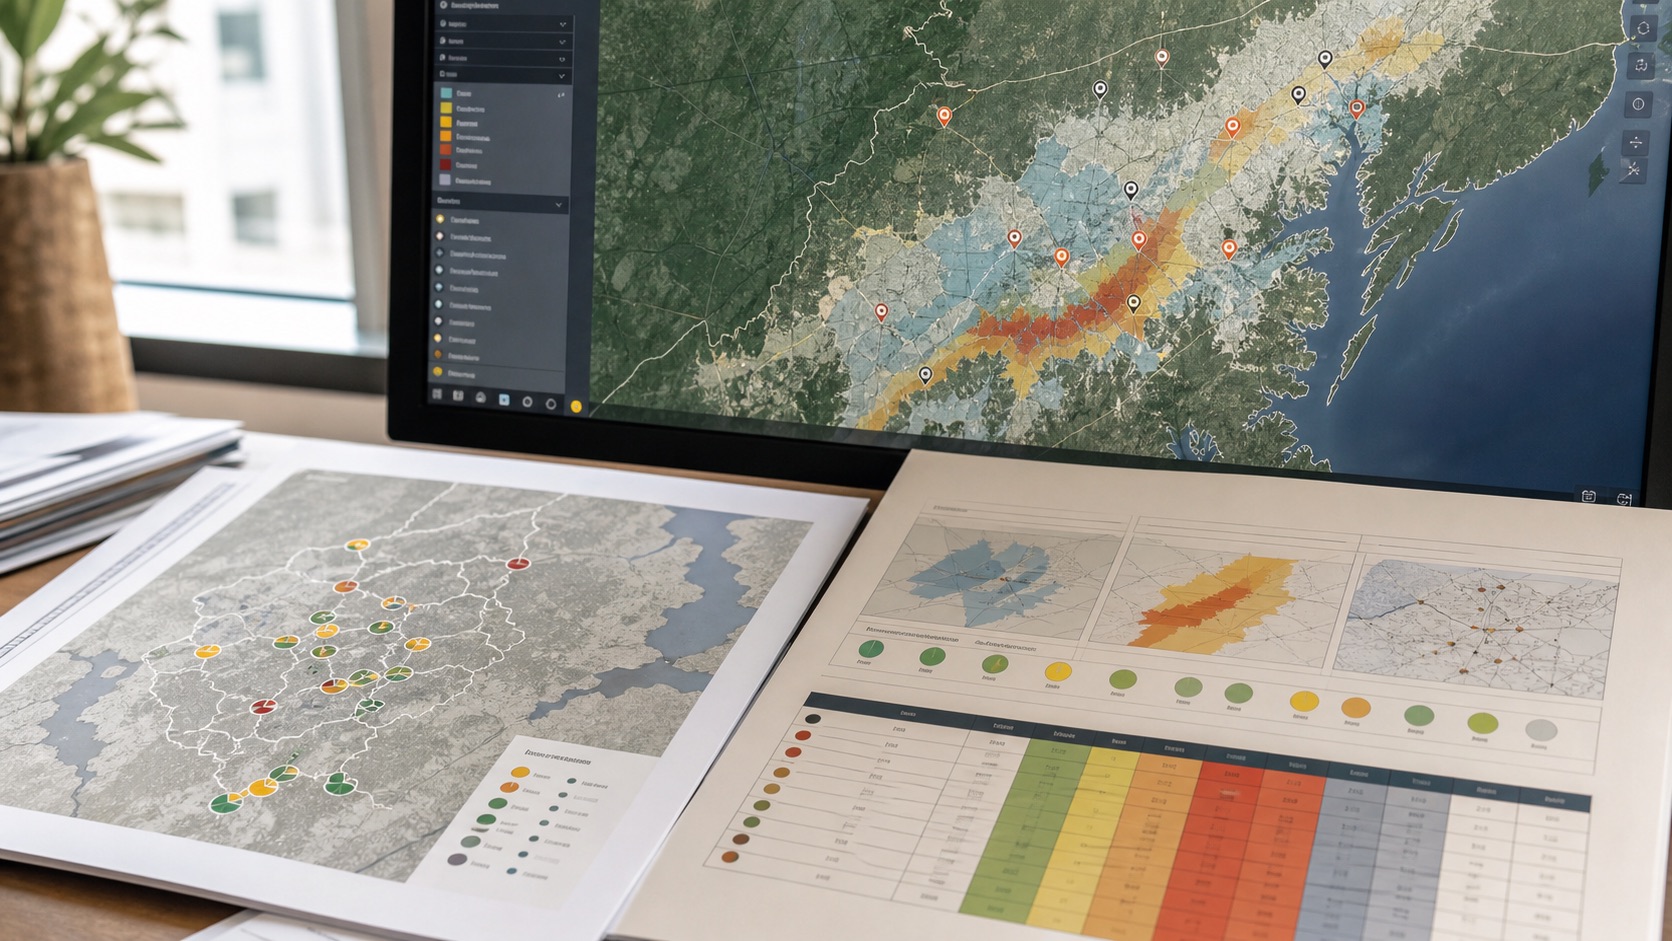
These are compact examples of the kind of report structure we use: input notes, maps, scoring tables, assumptions and recommendations.
Map work
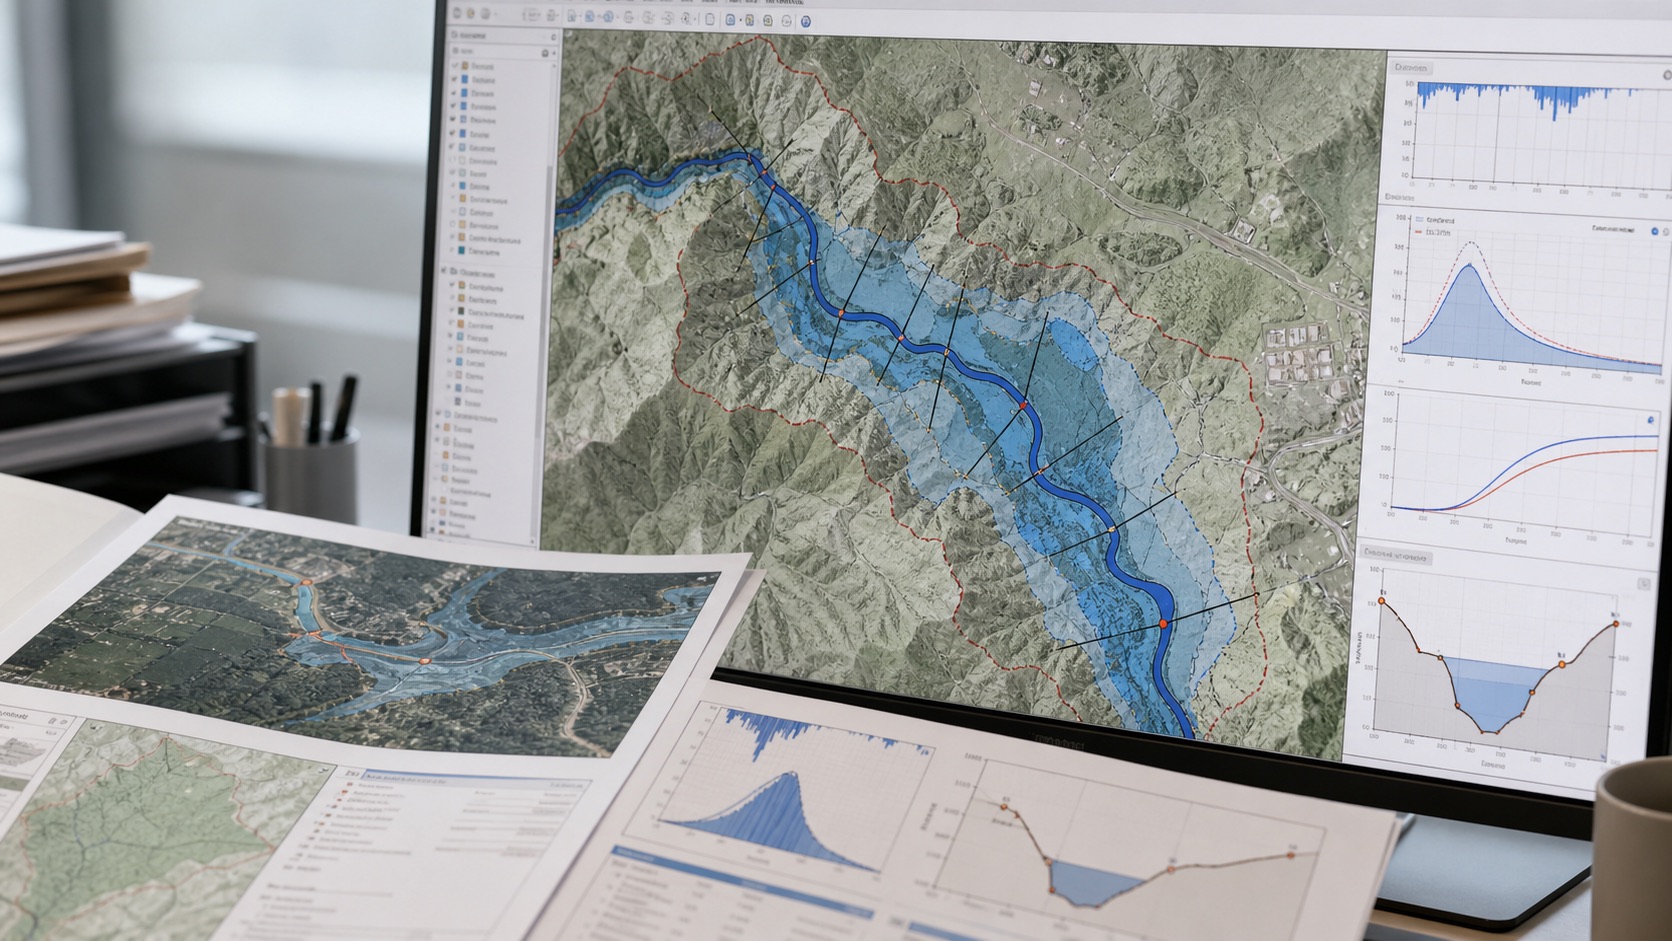
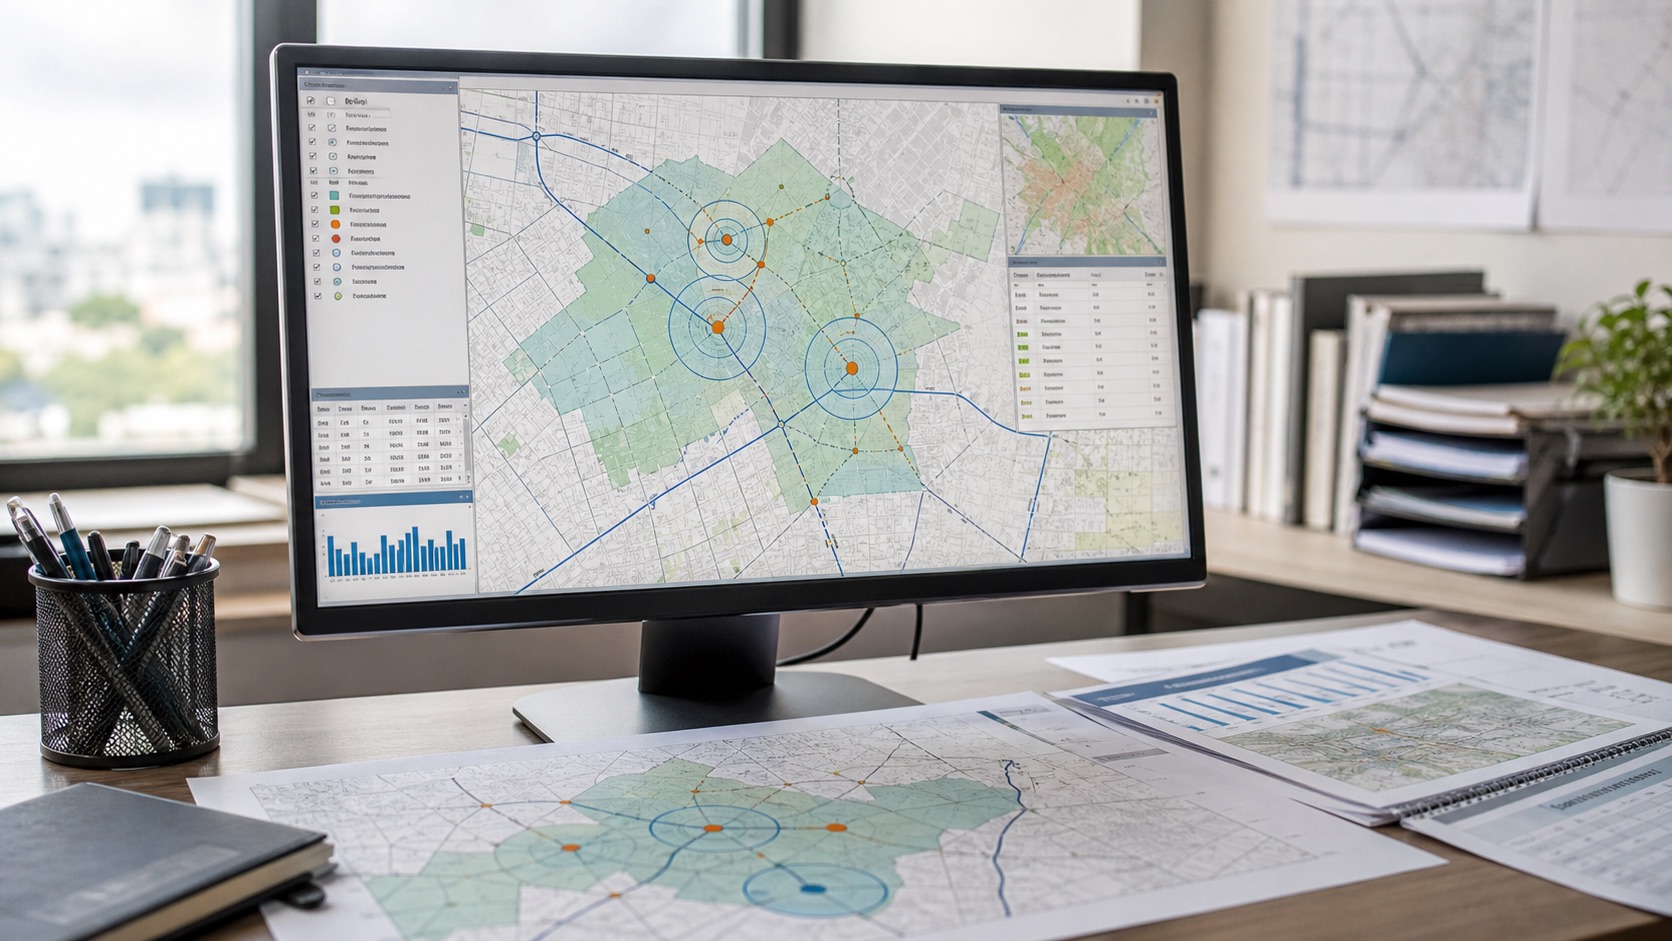
Floodplains, catchments, road networks, agricultural landscapes and asset portfolios need different data choices and different levels of validation.
Where it helps
The work is meant to narrow options, expose constraints, and give reviewers enough context to ask better questions.
Identify flood, climate, access, terrain and environmental constraints around assets and projects.
Use criteria and confidence notes to rank sites, branches, catchments and infrastructure needs.
Understand route, service, facility and supply-chain dependencies across space.
Share maps, GIS layers, tables and recommendations with the assumptions visible.
Industries
A floodplain may be a catastrophe exposure for insurance, a collateral concern for banking, a route-disruption risk for logistics and a design constraint for infrastructure.
Explore industry applications →Flagship platform
Choose a domain lens, location basis and analysis radius. The engine orchestrates geospatial sources, excludes unavailable evidence instead of guessing, and shows the score, weights, sources and confidence.
Representative engagements
These examples illustrate common project patterns. The exact datasets, model depth and validation depend on the decision and geography.
Combine hazards, accessibility, economic context, demographics and market signals for location-aware underwriting and branch decisions.
View approach →InfrastructureConnect rainfall, catchment response, hydraulic conditions and exposed assets into defensible planning outputs.
View approach →Retail & servicesEvaluate catchment demand, competition, access, cost, exposure and confidence instead of relying on footfall alone.
View approach →How we work
Define the user, geography, threshold, time horizon and consequence of being wrong.
Select spatial layers, sources, scale, freshness and validation appropriate to the domain.
Build the spatial workflow, test sensitivity and document confidence and limitations.
Provide a report, maps, GIS layers, analytical outputs and recommendations suited to the decision.
Insights
Expert-led articles on geospatial risk, flood modelling, site selection, remote sensing and data quality.
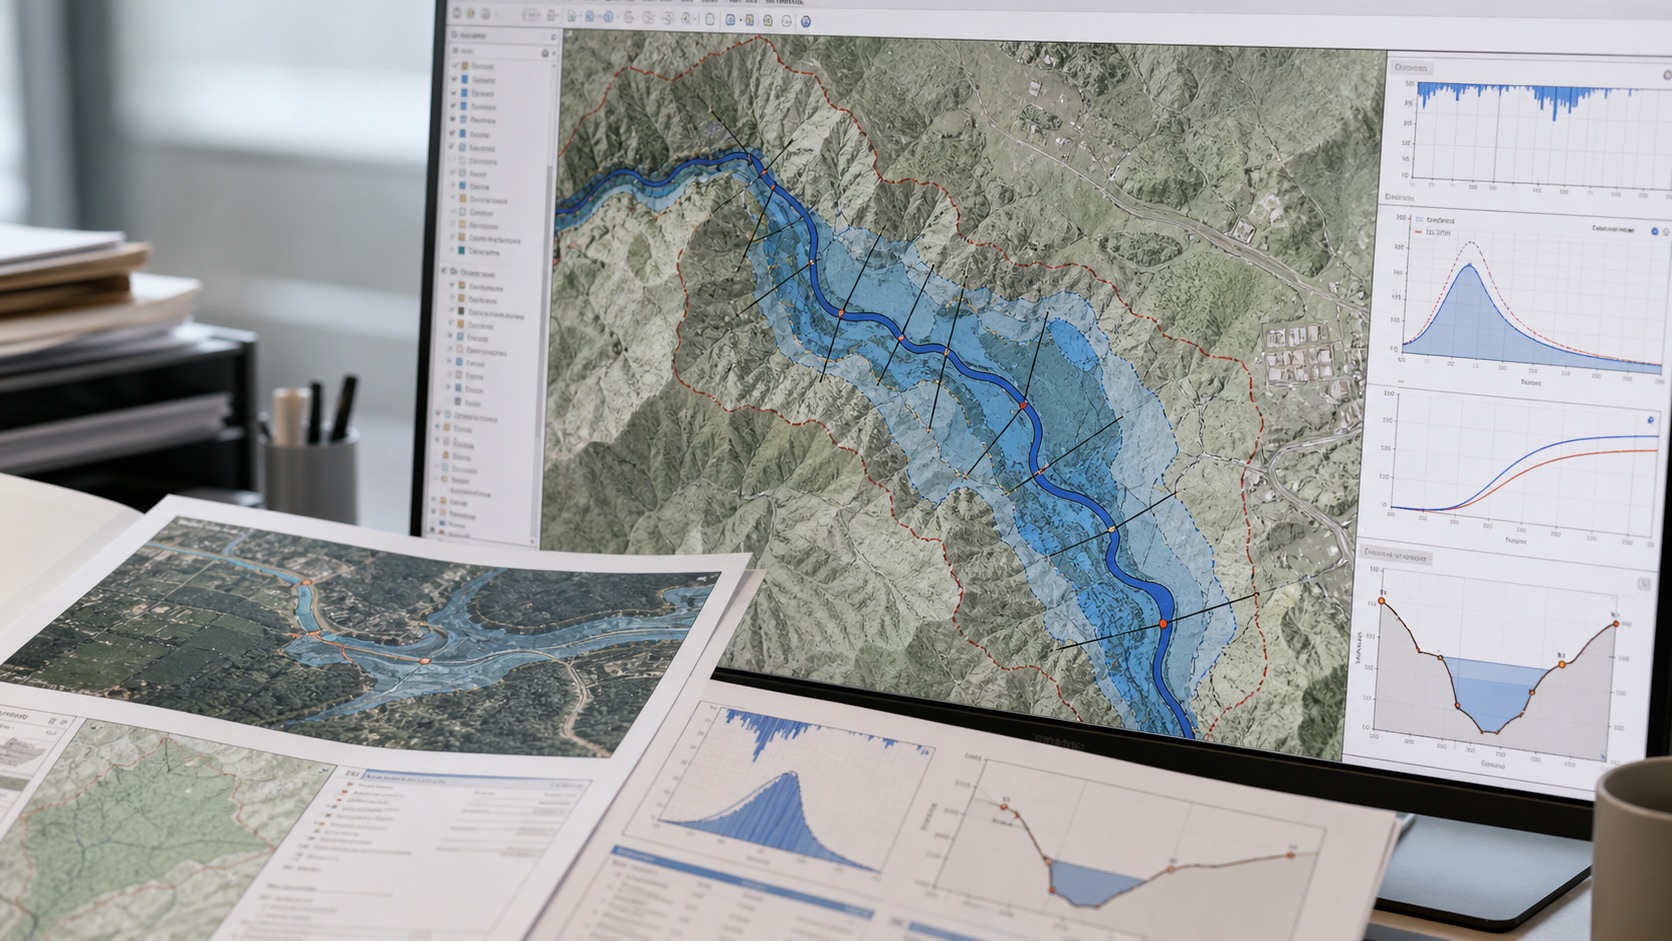
How catchments, design storms, hydrographs and hydraulic models connect.
Evaluate demand, access, competition, hazards and confidence together.
Build transparent domain lenses instead of one generic answer.
How we keep work reviewable
Each report explains source dates, coverage gaps, model assumptions and places where field or official validation is still needed.
A flood study, site ranking and portfolio screen should not look the same. The method and format change with the decision.
When useful, the work includes GIS layers, tables and repeatable scoring logic so the next location can be compared consistently.
Start a conversation
A boundary, site list, route, catchment or even a rough map is enough for a first scoping call. We will tell you what can be analysed, what data is missing and what output format makes sense.
GIS · Flood & hydrology · Remote sensing · Climate risk · Site selection · Custom platforms
Discuss your project