GeoRisk Intelligence

Asset-level location risk analytics across multiple decision lenses.

Our flagship platform turns a coordinate into a domain-specific risk and opportunity assessment while showing flood exposure, climate context, infrastructure intelligence, spatial patterns, signal weights, sources, confidence and unavailable evidence for portfolio risk screening.

Why it exists

A generic location score hides the question that matters.

Flood risk may dominate insurance, vegetation and water may dominate agricultural lending, while roads, logistics and fuel access may dominate supply-chain decisions. GeoRisk applies a different transparent weight profile for each decision lens.
46signal categories
16decision lenses
5–100 kmanalysis scopes
Visiblesources and confidence
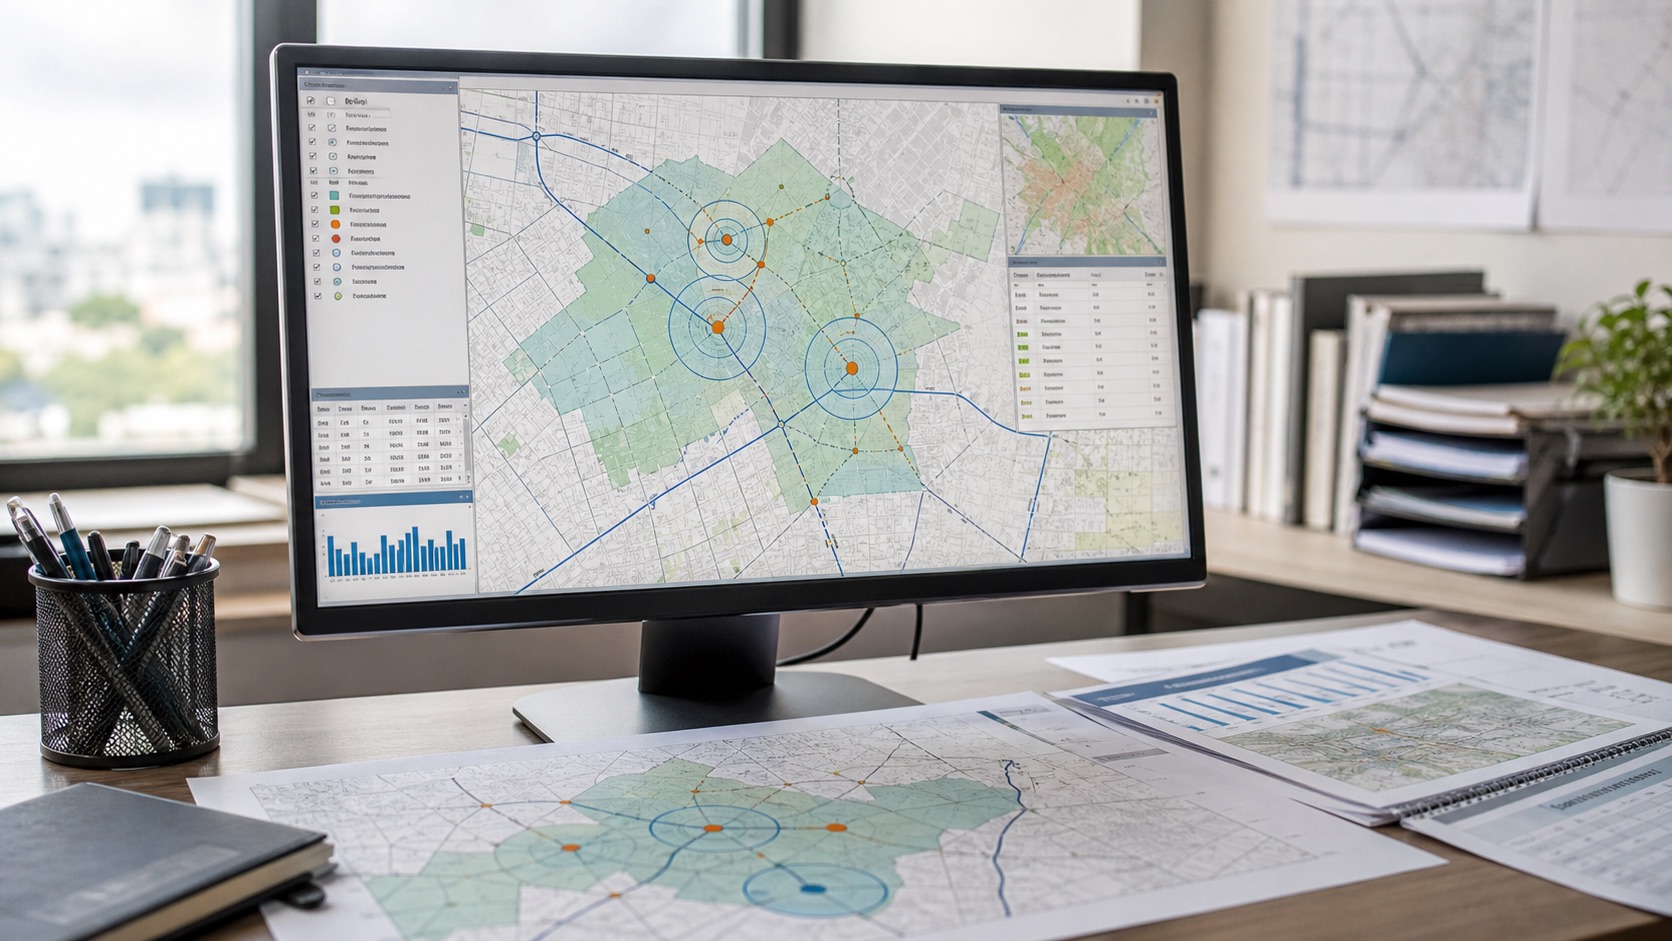
Geospatial intelligence and site analysis illustration

Product context

Designed for spatial decisions, not generic map viewing.

GeoRisk Intelligence helps teams screen, compare and explain locations. The output brings together asset-level intelligence, lens-specific weights, source confidence and recommendation logic.

Try the demo tool

Platform capabilities

Built for screening, comparison and explainability.

Domain-specific lenses

Lending, insurance, retail, logistics, healthcare, real estate, climate, disaster response and other use cases.

Source confidence

Every usable signal carries confidence and source context. Weak or unavailable data is not silently converted into risk.

Protected provider calls

API keys stay server-side. Provider requests use allowlists, queues, timeouts, rate limits and sanitized logs.

Decision overlay

The result connects the composite score to domain-specific recommendations, conditions and leading contributors.

Flexible geography

Use an exact asset coordinate, service catchment or operating area with configurable analysis radius.

Custom integration

Production deployments can combine public sources with internal asset, customer, policy and verified local datasets.

01

GeoRisk scoring methods

GeoRisk Intelligence is designed for screening and prioritisation. It keeps individual signals, lens weights, source confidence and unavailable evidence visible so teams can review the result instead of accepting a black-box score.

  • Signal collection: gather hazard, access, market, environmental, infrastructure, demographic and remote-sensing indicators around a coordinate or area.
  • Domain lens weighting: apply different weight profiles for banking, insurance, logistics, retail, healthcare, infrastructure, climate and other decisions.
  • Coverage adjustment: separate missing or unavailable evidence from low risk so weak data does not create artificial confidence.
  • Source confidence scoring: track source type, spatial scale, recency, proxy strength and availability beside the final score.
  • Composite risk calculation: combine normalized signal contributions into interpretable risk, opportunity and confidence outputs.
  • Leading contributor analysis: show which signals drive the result, such as flood exposure, road access, market activity, water context or environmental sensitivity.
  • Scenario comparison: compare different radii, candidate locations, domain lenses or weighting assumptions to test sensitivity.
  • Decision notes: translate the score into conditions, recommended validation, limitations and next-step evidence needs.
02

Risk signal methods

Each signal family is handled according to its spatial meaning. A flood signal, road-access signal, event signal and market signal should not be interpreted with the same confidence or decision weight.

  • Hazard screening: flood, heat, drought, wildfire, seismic and weather context are reviewed as exposure indicators, not final engineering conclusions.
  • Accessibility analysis: roads, transit, airport access, logistics facilities and service dependencies are measured around the location.
  • Market and demographic context: population, economic activity, affordability, banking access and competitor density support demand and operational interpretation.
  • Environmental review: water proximity, soil, vegetation, air quality, industrial context and land-use mix add environmental friction or resilience context.
  • Operational location intelligence: geofences, route context, asset clustering, field observations or event timelines can be layered where teams need ongoing monitoring.
  • Portfolio comparison: many assets can be scored consistently so outliers, clusters and high-priority locations are easier to inspect.

Signal families

Hazards, access, market, environment and population context.

The full engine includes flood, climate, seismic, infrastructure, economic, banking, competitor, affordability, vegetation, crime, governance, air quality, water, transport, land, industrial, demographic and urban-form signals.

FloodDrought & heatSeismicRoad networkTransitAirport accessBanking accessCompetitor densityEconomic activityPopulation densityAge vulnerabilityWorking-age strengthLand-use mixBuilt-up intensityWater proximityAir qualityGroundwaterSoilVegetationWildfireLogisticsWalkabilityLightingSanitation