Remote sensing agriculture services

Remote sensing agriculture services for NDVI crop monitoring and satellite analysis.

Use satellite image analysis and GIS to monitor crop condition, vegetation health, crop stress, soil moisture mapping context, land cover, acreage, water stress and farming-area priorities without waiting for every field visit.

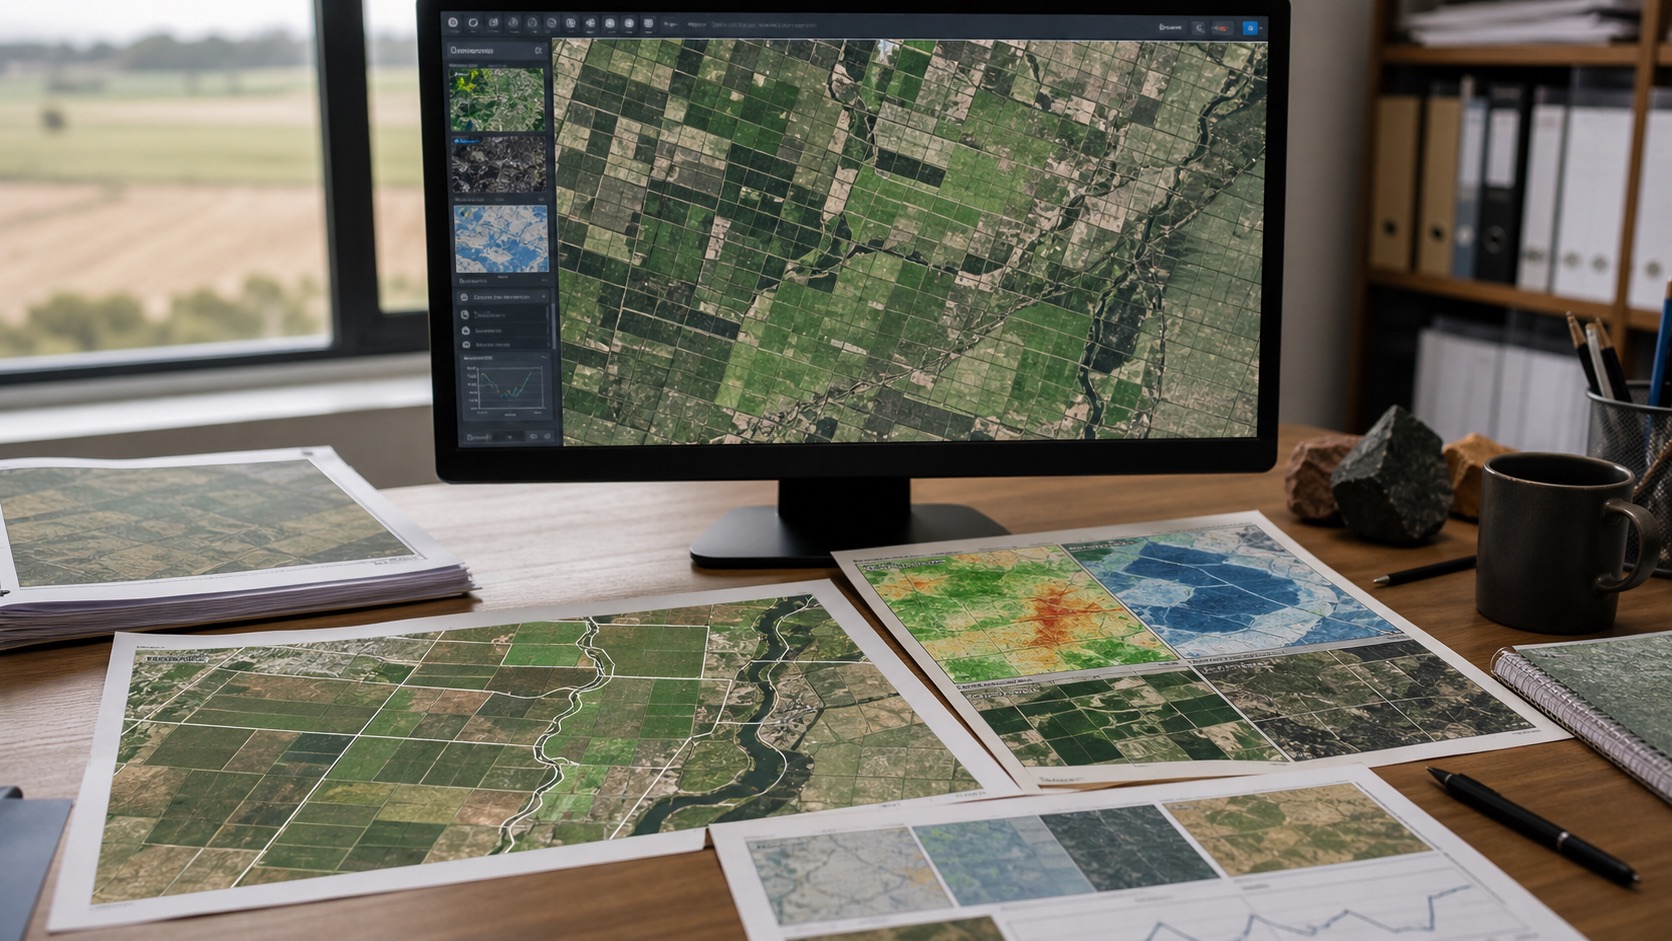
Satellite remote sensing agriculture crop monitoring dashboard
Crop monitoringVegetation, anomaly and seasonal trend review.
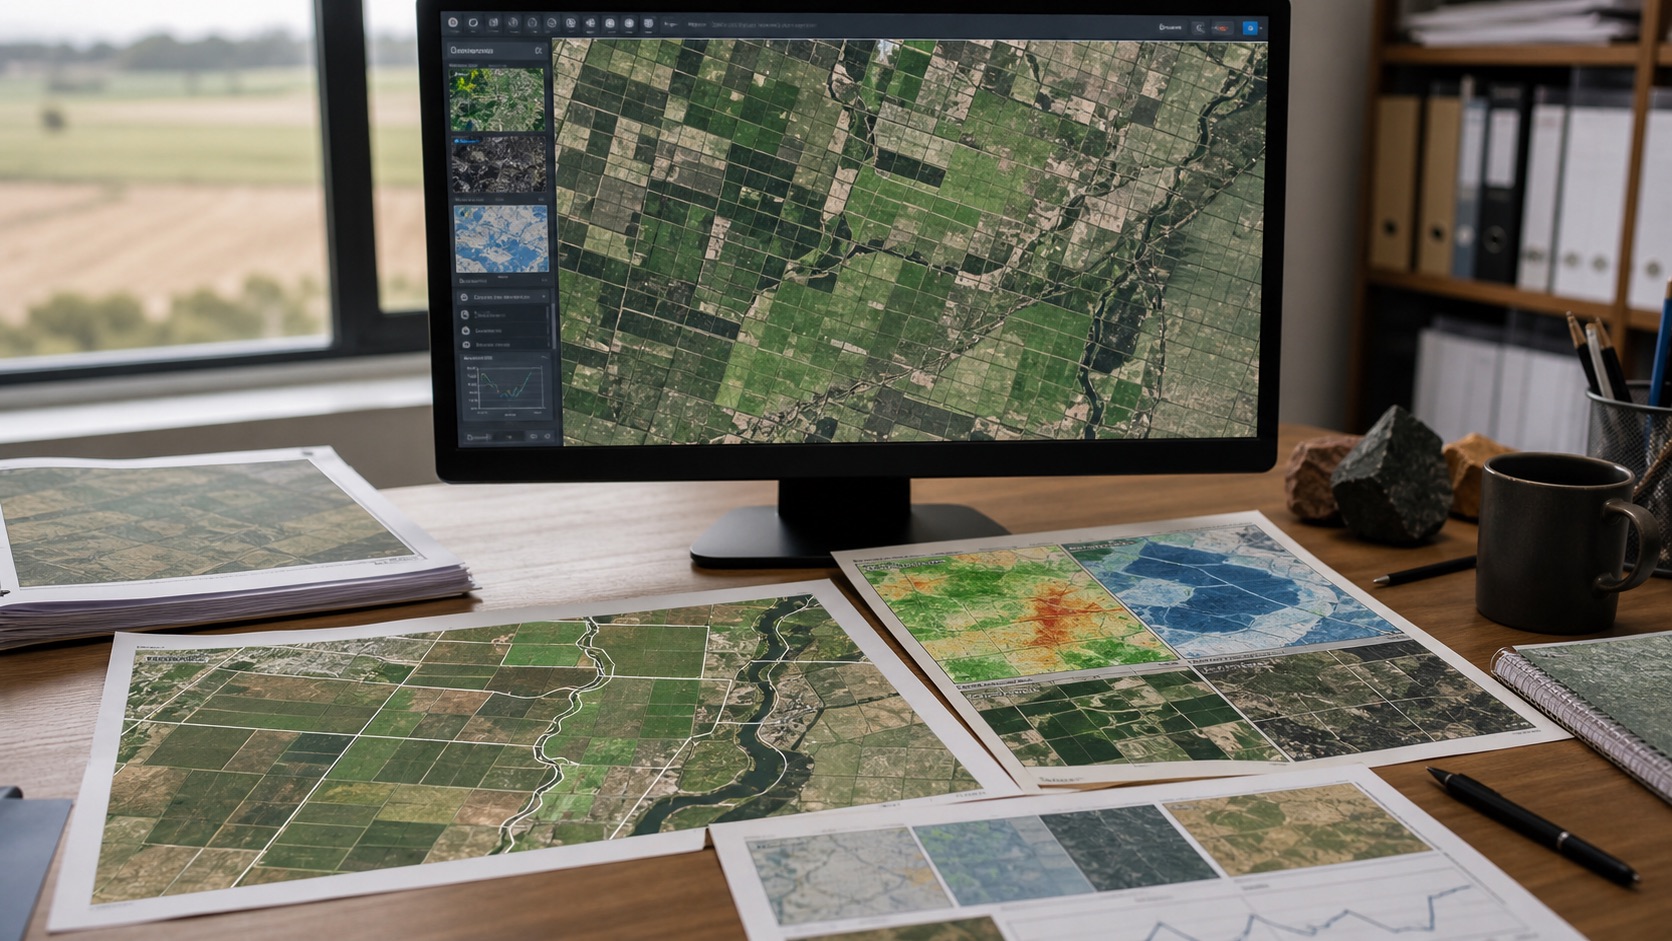
Agriculture remote sensing field and satellite analysis
Field intelligencePrioritise surveys, irrigation checks and field visits.
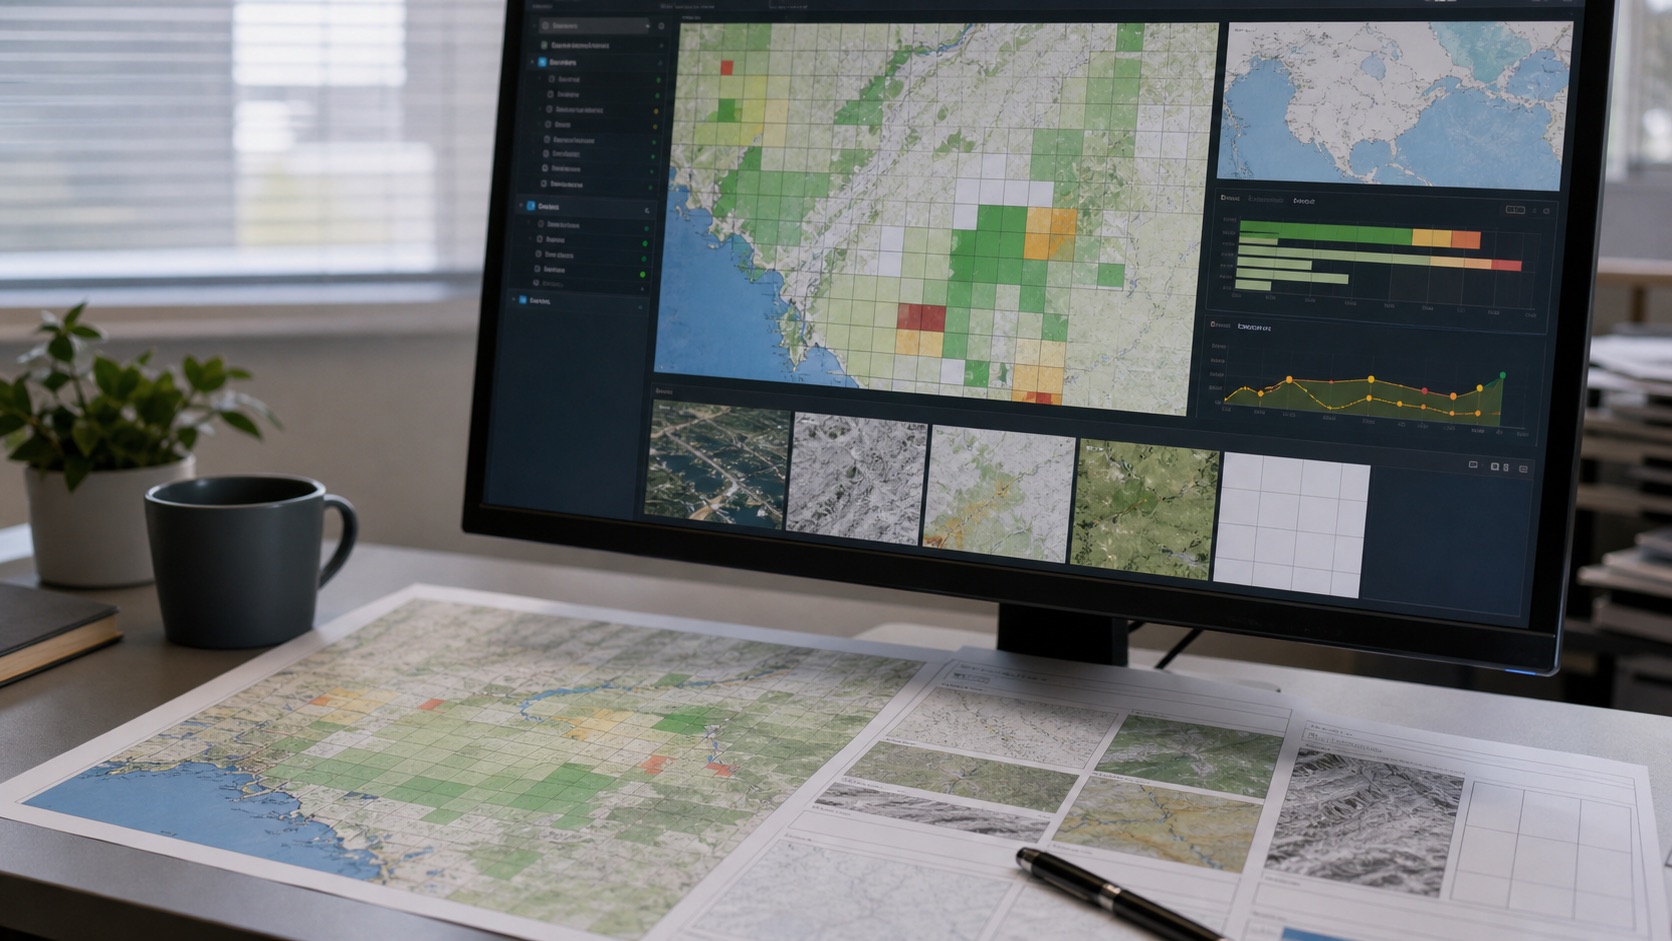
Remote sensing data quality and confidence review
Confidence notesCloud, resolution, date and source limitations stay visible.
01

What we analyse

We convert Sentinel-style satellite observations into practical agriculture remote sensing and farming indicators that can be reviewed by operations, agronomy, credit, insurance or planning teams.

  • NDVI crop monitoring and vegetation health monitoring
  • Crop stress and anomaly detection
  • Soil moisture mapping context and surface water review
  • Land use land cover mapping, LULC mapping and acreage checks
  • Satellite image analysis for drought, flood and climate exposure overlays
  • Field-priority maps and ranked survey lists
02

When it helps

Remote sensing is strongest when a team needs repeated, scalable evidence across many farms, districts or portfolios. It helps narrow attention before field verification.

  • Agriculture portfolio screening
  • Crop-condition monitoring during a season
  • Farm boundary and land-cover review
  • Change detection for encroachment or land conversion
  • Insurance, lending and government-program support
03

Outputs

Deliverables are matched to the decision: a compact report, GIS layers, field lists, maps, tables or a repeatable monitoring workflow.

  • PDF reports with maps and assumptions
  • GIS layers in GeoJSON, shapefile or project formats
  • NDVI and change detection analysis summaries
  • Crop monitoring using satellite imagery for seasonal review
  • Confidence notes for cloud, resolution and source dates
  • Recommendations for field validation
04

Crop monitoring using remote sensing

Crop monitoring using remote sensing is most useful when the question is repeated across many fields: which farms are changing, which fields look stressed, where should a team inspect first and how confident is the signal?

  • Seasonal vegetation trend review using NDVI and related indices
  • Crop-condition comparison across farms, villages, districts or portfolios
  • Early field-priority screening before agronomy or inspection visits
  • Drought, flood, heat and water-stress context layered with crop signals
  • Cloud, image date and spatial-resolution notes beside each output
05

Remote crop monitoring systems

A remote crop monitoring system can be delivered as a report, repeatable GIS workflow or dashboard specification depending on the number of farms and how often the team needs updates.

  • Satellite imagery time-series workflow for repeat monitoring
  • Field ranking by vegetation anomaly, water context or change signal
  • GIS layers for farm boundaries, crop zones and field-priority lists
  • Dashboard-ready tables for crop monitoring, lending, insurance or public programs
  • Documented assumptions so field teams can validate the highest-priority areas
06

Remote sensing agriculture methods

Different agriculture questions need different remote sensing methods. We select the method based on crop type, field size, revisit frequency, cloud conditions, decision deadline and whether the output is for operations, lending, insurance or planning.

  • Vegetation index analysis: NDVI, EVI, SAVI and related indices help compare crop vigour, canopy response and vegetation anomalies.
  • Time-series monitoring: repeated images show crop growth stages, seasonal trends, delayed planting, harvest timing and persistent stress.
  • Change detection: before-and-after imagery highlights land conversion, flood impact, encroachment, field disturbance or unusual vegetation loss.
  • Land use land cover classification: supervised or rule-based LULC mapping separates crop areas, bare soil, water, built-up land, trees and other land categories.
  • Crop stress and anomaly mapping: current imagery is compared with nearby fields, previous dates or a seasonal baseline to flag areas for field review.
  • Water and moisture context: surface water, drainage, rainfall, soil moisture products and terrain are layered with vegetation signals to interpret possible water stress.
  • Thermal and heat review: land surface temperature and heat context can support drought, irrigation and crop-stress screening where suitable data is available.
  • SAR and cloud-aware monitoring: radar imagery can support monitoring in cloudy regions, especially for surface water, flooding, roughness and broad crop-condition context.
  • Field boundary and acreage analysis: farm boundaries, parcel data or digitised fields are used to summarize signals by field instead of only by image pixel.
  • Validation and confidence scoring: outputs include source date, cloud, resolution, baseline and field-verification notes so teams know how much confidence to place in the result.
07

Agriculture remote sensing use cases

The same satellite signal can support different decisions when the interpretation changes by user, crop season, geography and risk tolerance.

  • Farming operations: prioritise irrigation checks, crop scouting and input planning
  • Agricultural lending: screen farm portfolios and collateral exposure
  • Insurance: compare crop stress, flood exposure and possible loss-review areas
  • Government programs: monitor land cover, acreage and vulnerable farming areas
  • Climate and disaster review: connect crop condition with drought, heat, flood and water signals

Remote sensing FAQ

Crop monitoring using remote sensing questions.

What is crop monitoring using remote sensing?

Crop monitoring using remote sensing uses satellite imagery and vegetation indices such as NDVI to review crop condition, seasonal growth, stress patterns, water context and field-priority areas across farms or districts.

How is remote sensing used in agriculture?

Remote sensing is used in agriculture to monitor vegetation health, compare fields, detect crop stress, map land cover, review surface water, support drought or flood screening and decide where field validation should happen first.

What is NDVI crop monitoring?

NDVI crop monitoring measures vegetation greenness from satellite imagery. It helps compare relative crop vigour, identify anomalies, track seasonal change and flag fields that may need agronomy, irrigation or field review.

Can satellite imagery detect crop stress?

Satellite imagery can reveal crop stress signals when vegetation, moisture, heat, flood or drought patterns differ from expected conditions. These signals should be interpreted with crop calendar, weather, field knowledge and validation.

What are remote crop monitoring systems?

Remote crop monitoring systems combine satellite imagery, GIS layers, vegetation indices, time-series review, ranked field lists, dashboards or reports so teams can monitor many farms without visiting every field first.

Need crop or farming-area intelligence?

Send a boundary, farm list, district, crop season or monitoring question and we will scope the remote sensing agriculture workflow.

Discuss the requirement