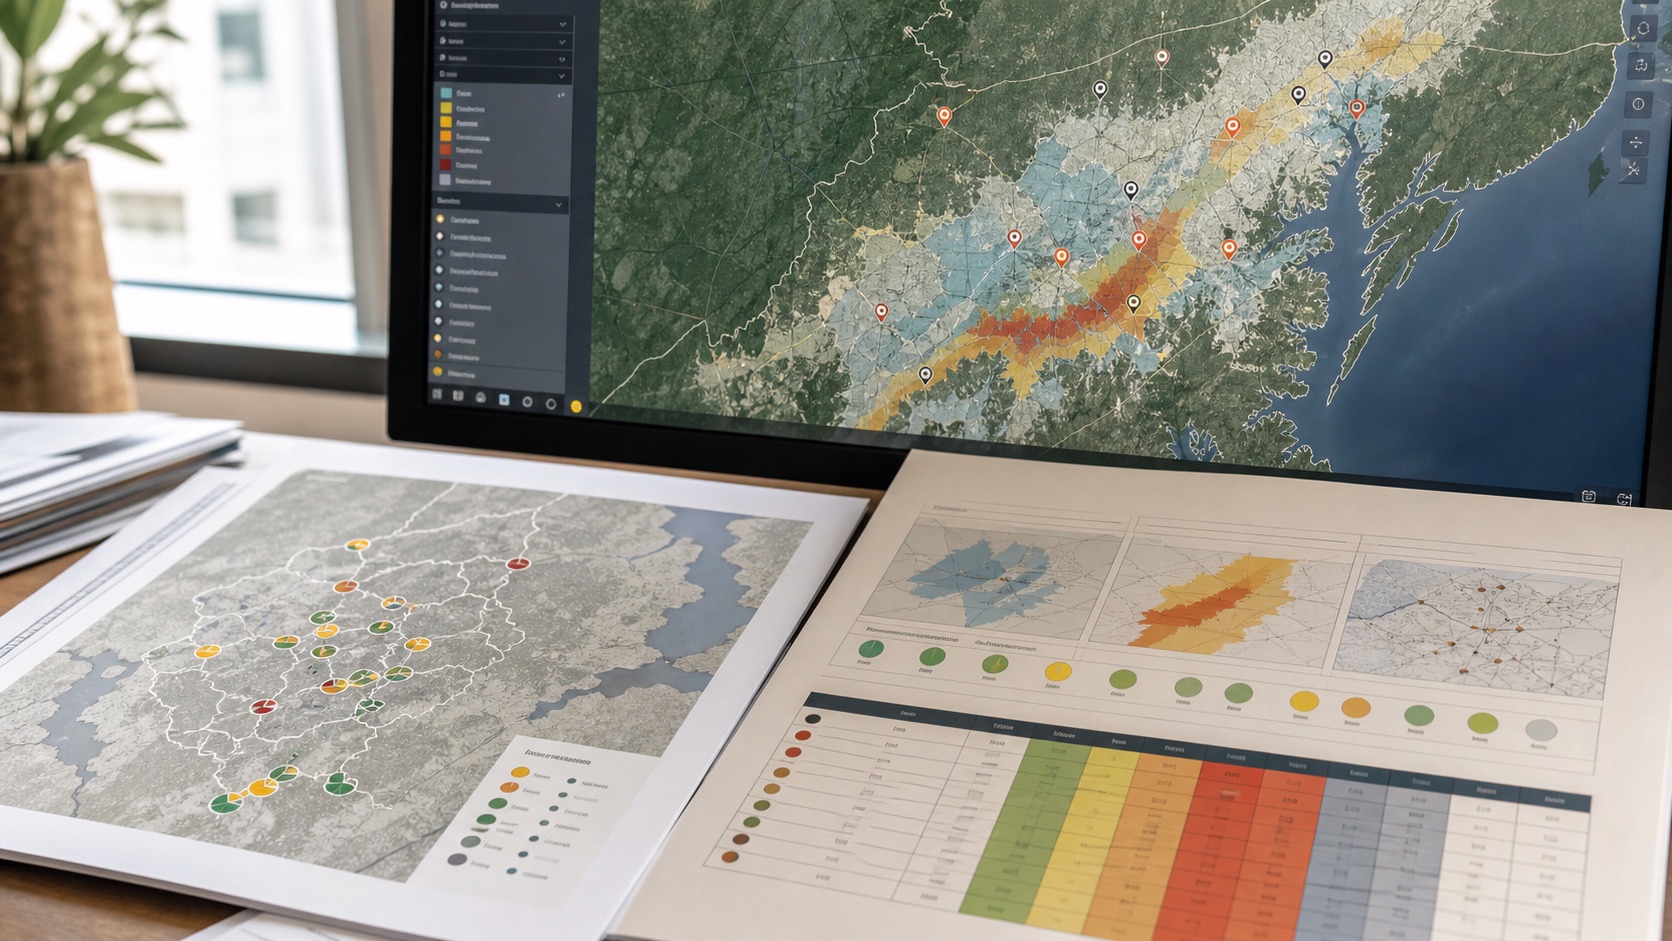
A geospatial risk engine begins with a simple input: a place, address or coordinate. The useful output, however, is not a single score. It is a structured explanation of the location, the signals observed, the confidence available and the decision context in which those signals matter.
Step 1: Resolve the location
The engine first converts a place name into latitude and longitude, or validates coordinates supplied directly. It also retrieves country and administrative context because some datasets are local while others are only available at country or regional level.
Step 2: Orchestrate spatial sources
Different providers contribute different layers: weather, flood discharge, seismic events, mapped facilities, air quality, soil, population and macroeconomic context. Each source has its own response time, quota, geography and reliability.
A production system should call those sources behind a server-side orchestration layer rather than directly from the browser.
Step 3: Convert observations into signals
Raw values need interpretation. A count of hospitals, for example, means little without radius and area. A river-discharge value needs a reference level. A high number of competitors may represent strong demand or excessive pressure depending on the lens.
GeoRisk Intelligence groups signals across natural hazards, climate, infrastructure, access, market activity, environment, urban form and demographics. The public message is “34+ signals”; the internal catalogue can expand as stronger data sources are added.
Step 4: Apply the domain lens
The same signal should not carry the same importance everywhere. Flood risk may dominate catastrophe insurance, while transit and footfall matter more for retail. Agricultural decisions need vegetation, soil, rainfall and water context. Healthcare planning needs access, population vulnerability and facility coverage.
A domain lens is not a different map. It is a different interpretation of the same place.
Step 5: Track confidence and coverage
Two controls are critical:
- Signal confidence describes the reliability and geographic relevance of the source.
- Weighted coverage measures how much of the selected lens has usable evidence.
If a source is weak or unavailable, the signal should be excluded—not replaced with a convenient default. The result can then be blocked or labelled as screening-only when coverage is insufficient.
Step 6: Explain the output
A useful result identifies the top contributors, source status, weight, confidence and recommended next action. For a non-lending lens, that may be “proceed,” “monitor” or “enhanced review.” For lending, a geospatial layer may inform conditions or manual review, but should never replace credit policy and borrower evidence.
What should be added in production?
Public data is valuable for a global first screen. Production deployments should add client asset masters, official national datasets, verified hazard layers, field surveys, internal operations, claims or performance history, and policy rules. That is where a general engine becomes a client-specific decision product.